Your Real-Time Indicator for Aurora and HF Radio Conditions
If you’ve ever wondered how space weather forecasters know when the aurora will light up the night sky — or why HF radio bands suddenly go from wide open to eerily quiet — you’re really asking about one key measurement: the Hemispheric Power Index, or HPI.
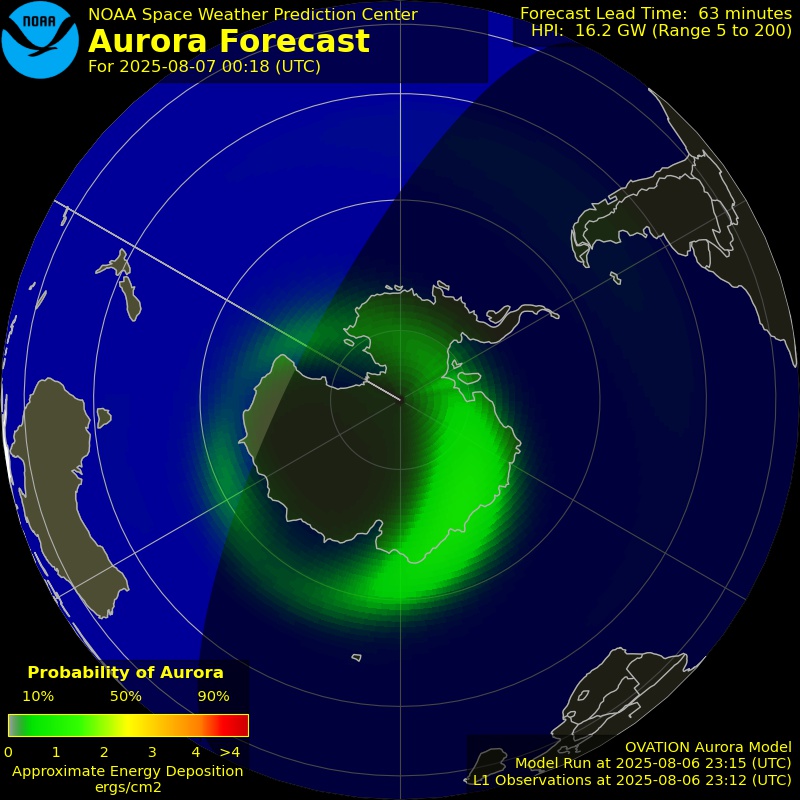
HPI is a calculated value, expressed in gigawatts (GW), that estimates the total amount of energy pouring into the Earth’s upper atmosphere via the auroral regions of either the Northern or Southern Hemisphere. This energy transfer is driven by the interaction between the solar wind and the Earth’s magnetosphere — the giant magnetic bubble that shields us from most of the Sun’s charged particles.
When solar wind conditions are calm, HPI values remain low, auroras are quiet, and HF radio propagation behaves predictably. But when the Sun hurls out a coronal mass ejection (CME), high-speed stream, or intense burst of solar wind, HPI values can spike dramatically, signaling strong energy coupling into the polar regions. That’s when both the aurora and HF propagation can change in minutes.
How HPI Is Calculated
The HPI isn’t measured directly — it’s derived from satellite observations of:
- Solar Wind Speed (km/s)
- Solar Wind Density (particles/cm³)
- Interplanetary Magnetic Field (IMF) Bz component (nT)
Using these real-time readings, models estimate how much power is being transferred from the solar wind into the upper atmosphere through the polar regions. This energy is expressed in gigawatts, the same unit used to measure the output of entire power plants — except here, we’re talking about invisible currents flowing high above Earth.
Why HPI Matters for HF Radio Operators
For HF communications, particularly at high latitudes or on long-distance polar paths, the HPI is a game changer. It’s essentially a “space weather fuel gauge” for ionospheric disturbance.
Here’s what the typical ranges mean:
- Quiet (<10 GW) – Calm auroral oval. Excellent HF propagation on all bands.
- Unsettled (10–25 GW) – Weak auroral activity. Slight variability, but conditions remain solid.
- Active (25–50 GW) – Moderate auroral currents. Polar path signals may start to fade or flutter.
- Minor Storm (50–100 GW) – Significant HF disruptions on high bands (10–20 meters). Lower bands may remain stable.
- Moderate Storm (100–200 GW) – Severe polar absorption. Higher MUF drops. 40–80 meters may be the most reliable bands.
- Strong Storm (200–400 GW) – Broad HF degradation. Contacts over polar paths become unreliable or impossible.
- Extreme Storm (>400 GW) – Nearly complete HF blackout conditions, especially for polar and transpolar communication.
HPI and the Aurora Connection
Auroras — those shimmering green and red lights in the night sky — are visible evidence of high HPI values. When charged particles from the solar wind collide with oxygen and nitrogen atoms in Earth’s upper atmosphere, they emit light and create the auroral display.
For a visual observer, this is a treat. For a ham radio operator, though, a high HPI means those same particles are also absorbing HF radio signals in the D-layer of the ionosphere.
The effect is strongest along the auroral oval and polar cap, but during strong storms, absorption can extend well into mid-latitudes. That’s why a high HPI often coincides with reports of weak or completely absent signals on normally reliable bands.
How SolarCdx.com Displays HPI
At SolarCdx.com, we present the HPI in a real-time, interactive display designed for both quick checks and deeper understanding. Here’s what you’ll see:
- Large, color-coded HPI value in gigawatts, updating automatically.
- Classification badge (Quiet, Active, Minor Storm, etc.) that you can click for a full explanation.
- Component breakdown showing the solar wind dynamic pressure and energy transfer rate that feed into the HPI calculation.
- Key solar wind parameters — speed, density, IMF Bz, and Kp index — so you can see the full space weather picture at a glance.
- HF impact notes tailored to radio operators, telling you exactly what the current HPI might mean for your on-air activity.
We’ve also matched each severity level to a distinctive color bar — greens for quiet conditions, yellows and oranges for moderate activity, and deep reds or purples for storm-level readings — so you can interpret the situation instantly.
Why You Should Monitor HPI Regularly
If you’re an HF operator who values your time on the air, knowing the current HPI can help you decide:
- When to operate: Low HPI? Fire up the rig — conditions are likely great.
- Which bands to choose: Moderate HPI? Consider moving from high bands to 40 or 80 meters.
- Whether to wait it out: High HPI and strong auroral activity? It might be better to conserve energy until conditions improve.
By incorporating HPI monitoring into your operating routine, you’re effectively giving yourself a space weather forecast for your shack — one that can maximize your DX opportunities and minimize frustration.
📡 Check the live Hemispheric Power Index now: https://solarcdx.com/hemispheric-power-index/