Understanding SolarCdx.com’s multi-parameter correlation engine and how to use tactical propagation intelligence
When you see “Disturbance Factor: 23.7” on SolarCdx.com’s correlation engine, you’re not looking at just another space weather number. You’re seeing the result of sophisticated multi-parameter analysis that
combines over a dozen space weather variables into a single tactical intelligence score designed specifically for amateur radio operations.
Understanding how to read and use the Disturbance Factor transforms you from someone who checks space weather into someone who masters tactical propagation intelligence.
The Multi-Parameter Foundation
Unlike traditional space weather sites that show you isolated numbers (K-index, solar flux, etc.), SolarCdx.com’s Disturbance Factor analyzes all parameters simultaneously and calculates their combined impact on HF propagation.
The Input Parameters
The correlation engine continuously analyzes:
🌍 Geomagnetic Response Indicators
- HP30/HP60 values (30/60-minute geomagnetic indices)
- K-index and A-index (traditional planetary averages)
- Delta H measurements from US observatories
🌬️ Solar Wind Environment
- Speed (km/s) – critical driver for geomagnetic coupling
- Density (particles/cm³) – affects coupling efficiency
- Temperature – indicates stream characteristics
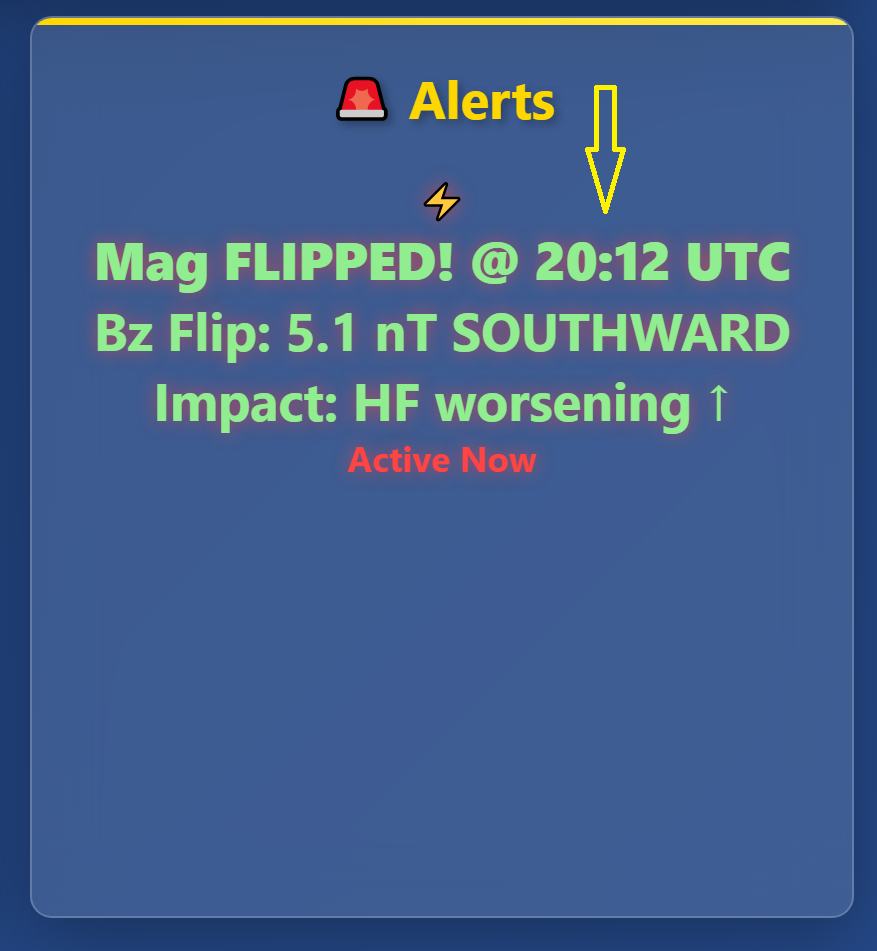
🧭 Interplanetary Magnetic Field (IMF)
- Bz component (north-south) – most critical for energy coupling
- By and Bx components – secondary field orientations
- Total field strength – overall magnetic environment
☀️ Solar Activity
- X-ray flare classification (A, B, C, M, X classes)
- Solar Flux Index (10.7cm radio emissions)
- Sunspot numbers and solar cycle indicators
Why This Matters
Single parameters lie. Combined analysis reveals truth.
Example: K-index shows “quiet” at 2.0, but solar wind is 650 km/s with Bz strongly southward. Traditional monitoring: “Good conditions.” SolarCdx.com Disturbance Factor: “Major storm developing in 60-90 minutes.”
Understanding the Scale: 0-100 Tactical Intelligence
[Image Placeholder: Disturbance Factor gauge showing color-coded scale]
The Scale Breakdown
- 0-15: EXCELLENT – Optimal propagation, all bands open, perfect for weak signal work
- 16-35: GOOD – Normal conditions, most bands usable, reliable for DX
- 36-55: MODERATE – Some disturbance, higher bands affected, monitor closely
- 56-75: ACTIVE – Significant impact, focus on lower bands, expect QSB
- 76-90: SEVERE – Major disruption, 40m and below recommended
- 91-100: EXTREME – Storm conditions, possible HF blackout
Why Not Just Use K-Index?
K-index limitations exposed by real scenarios:
Scenario 1: K=1 (looks quiet), but DF=47 (moderate disturbance)
- Reason: Solar wind 580 km/s with sustained southward Bz
- Reality: Storm onset in 2 hours, higher bands already showing degradation
- K-index verdict: “Go for it!”
- DF verdict: “Prepare for band changes”
Scenario 2: K=4 (looks active), but DF=12 (excellent)
- Reason: High solar flux with recovering geomagnetic conditions
- Reality: Enhanced propagation on all bands
- K-index verdict: “Avoid HF”
- DF verdict: “Prime DX conditions”
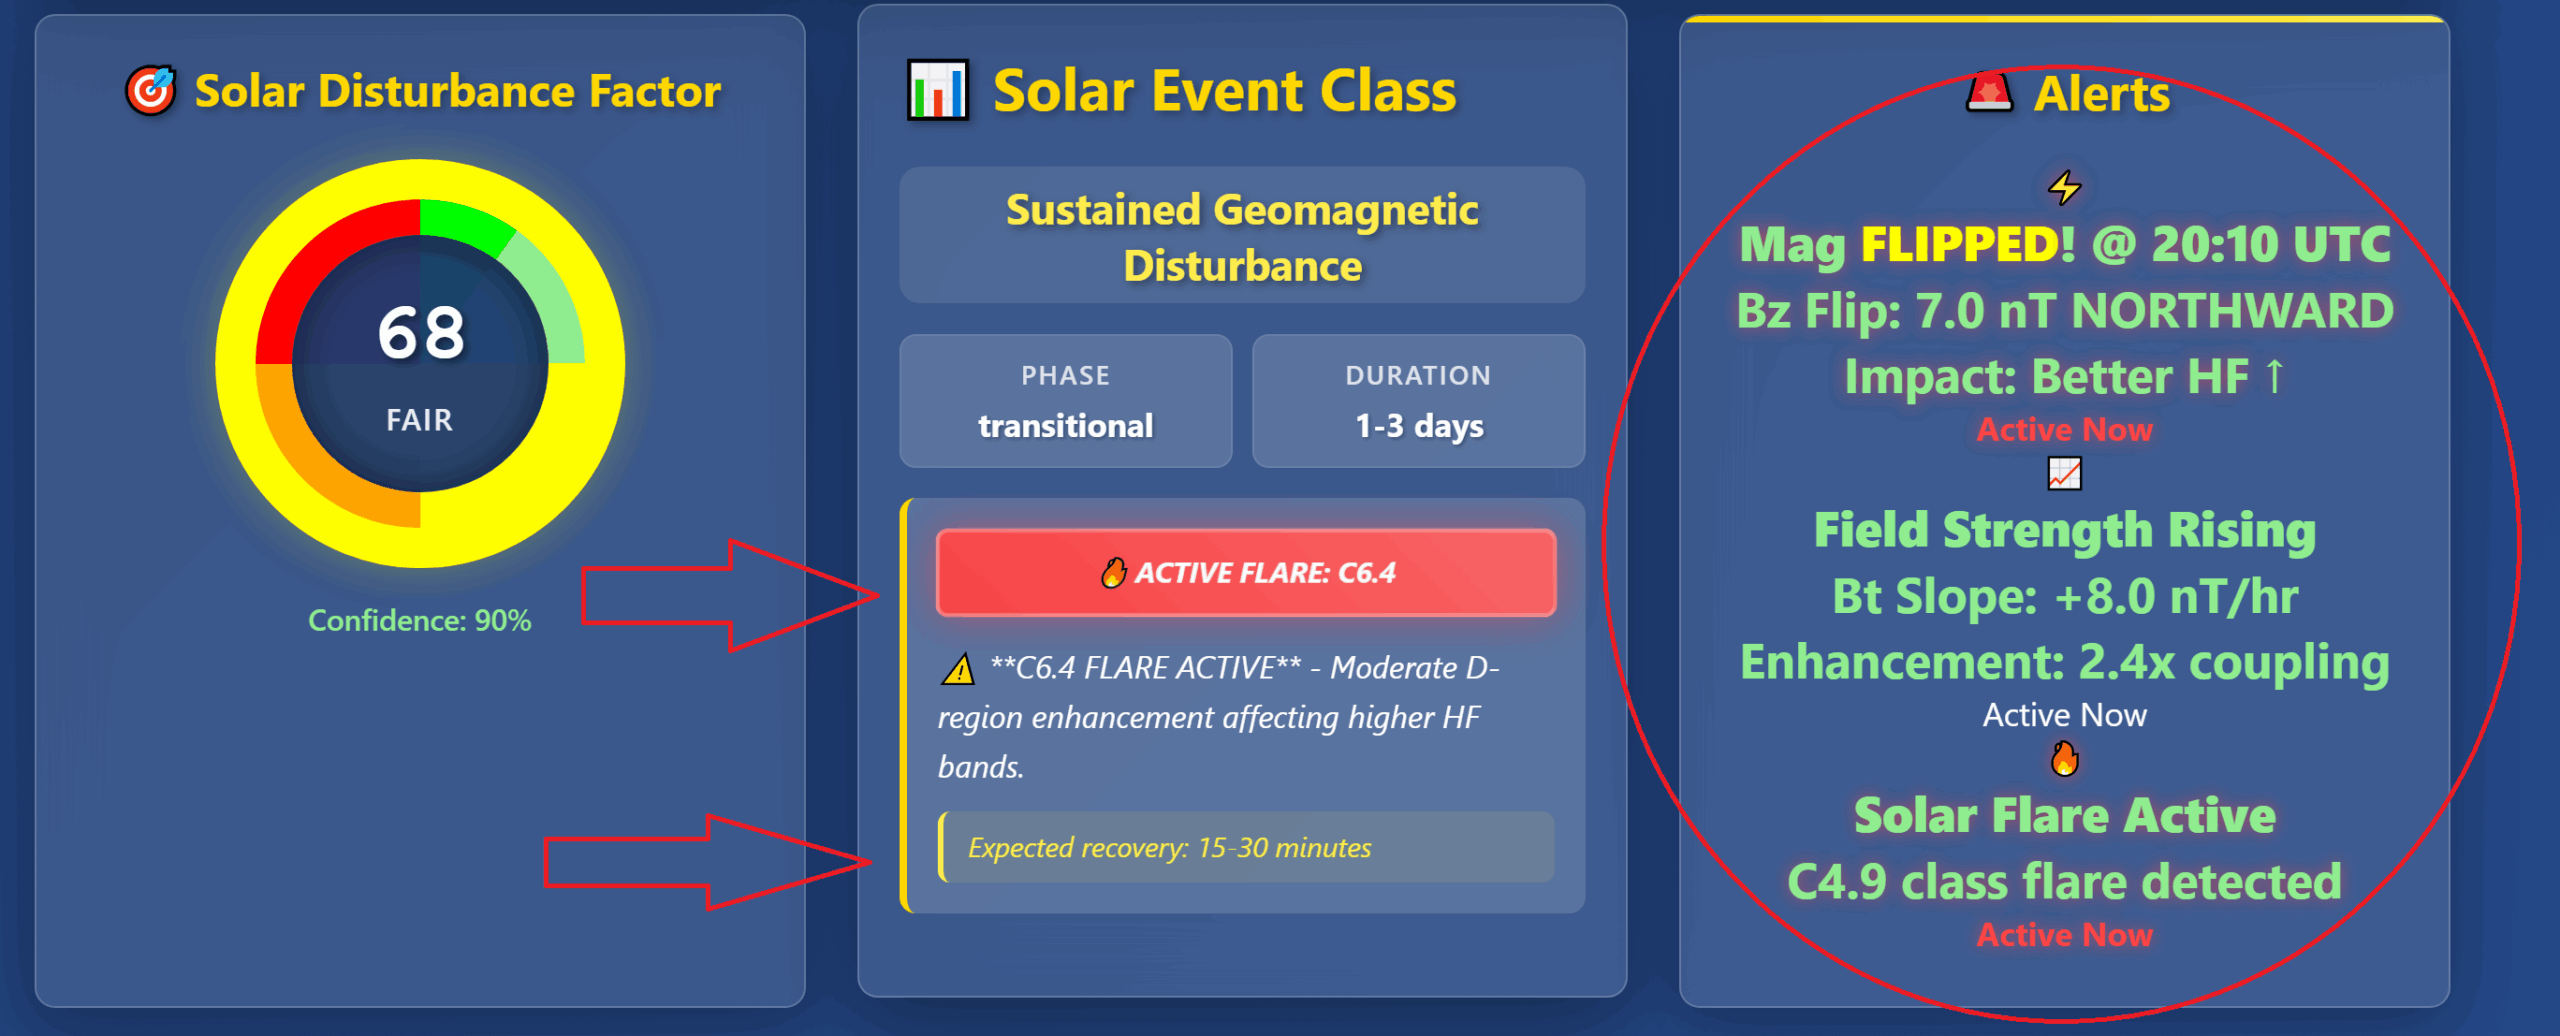
Reading the Dashboard: Your Tactical Command Center
[Image Placeholder: SolarCdx.com correlation engine dashboard screenshot]
Primary Display Elements
1. The Disturbance Factor Gauge
- Circular display: Color-coded from green (optimal) to red (severe)
- Current value: Real-time DF with confidence percentage
- Trend indicator: Rising, falling, or stable arrows
How to use it: The gauge gives you situation awareness at a glance. Green means go, yellow means monitor, red means adjust strategy.
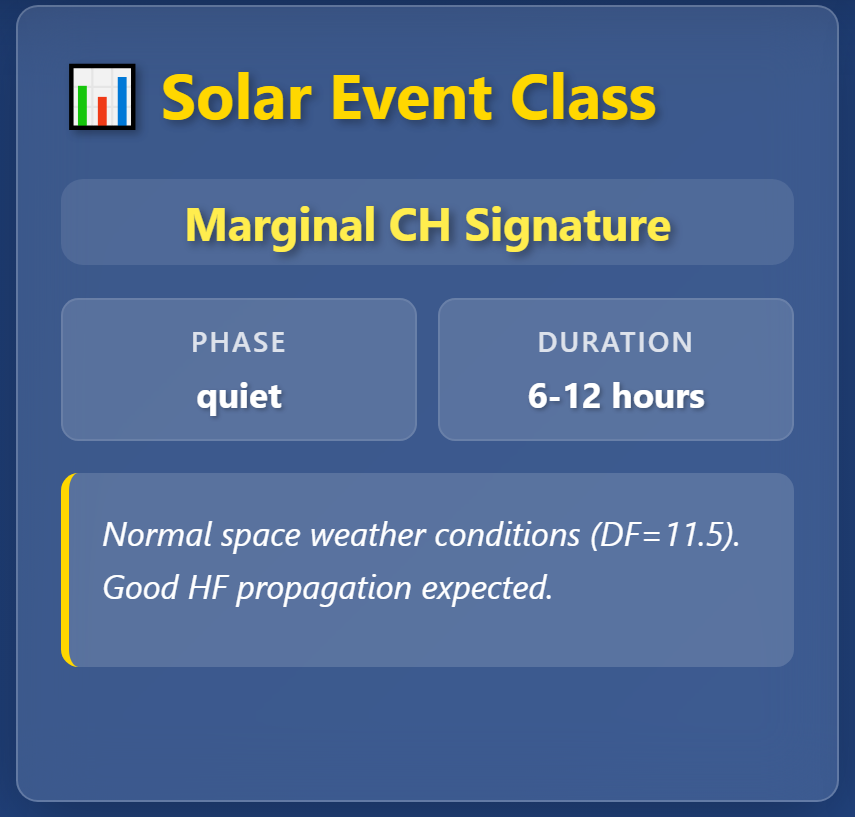
2. Event Classification Panel
- Event type: HSS (High-Speed Stream), CME, Flare, Quiet, etc.
- Phase indicator: Onset, Main, Recovery, Post-Storm
- Duration estimate: Expected length of current conditions
How to use it: Event type tells you what kind of disturbance you’re dealing with – each requires different tactical approaches.
3. Band-Specific Recommendations Grid
[Image Placeholder: Band recommendation cards showing scores 0-100]
Nine color-coded cards showing:
- Band name: 160m through 6m
- Score: 0-100 with descriptive text
- Tactical guidance: Specific recommendations per band
Score interpretation:
- 80-100: Excellent conditions for this band
- 60-79: Good, suitable for normal operations
- 40-59: Marginal, monitor for changes
- 20-39: Poor, consider alternatives
- 0-19: Very poor, avoid unless necessary
Advanced Display Elements
4. Current Space Weather Parameters
Real-time parameter values organized by category:
- Geomagnetic Activity: HP30, HP60, K-index, A-index
- Solar Wind: Speed, density, temperature
- IMF Components: Bz, By, Bt values
- Solar Activity: X-ray flux, solar flux, sunspot numbers
How to use it: These are your “raw ingredients.” Understanding how they combine helps you anticipate changes before the DF reflects them.
5. HF Synopsis Section
Automated analysis explaining current conditions in plain English:
- Current impact summary
- Trend analysis
- Tactical recommendations
- Timing predictions
How to use it: Your AI-powered space weather briefing. Read this first for situation awareness, then dive into specific parameters.
Tactical Applications: From Numbers to Strategy
Contest Operations
Pre-contest planning (24 hours before):
- DF trending downward: Plan aggressive high-band strategy
- DF showing HSS event: Expect recurring disturbances, flexible band plan
- DF in recovery phase: Timing advantage over competitors
Real-time contest decisions:
- DF suddenly rising: Early warning to change bands before others notice
- DF plateau at moderate levels: Stick with current strategy
- DF recovery prediction: Plan band changes 1-2 hours ahead
DX Operations
Rare DX timing:
- DF <20 with stable trend: Perfect time for weak signal paths
- DF 20-40 but declining: Good opportunity developing
- DF >50: Focus on strong signals and reliable paths only
Path assessment:
- High DF + specific event type: Some paths affected more than others
- Correlation engine event classification: Indicates which propagation modes work
Technical Operations
Weak signal digital modes:
- DF <25: Optimal for FT8/FT4 weak signal DX
- DF 25-45: Still workable but requires patience
- DF >45: Consider stronger modes or lower bands
Microwave/VHF enhancement:
- DF >60 with aurora event: Check 6m and 2m for enhancement
- Specific HSS events: May create VHF propagation opportunities
Advanced Interpretation: Reading Between the Lines
Correlation Multipliers in Action
The DF isn’t just additive – it uses correlation multipliers when parameters combine:
Enhanced coupling detected:
- High solar wind + strong southward Bz: DF amplified beyond simple addition
- Visual indicator: Event classification shows “Enhanced Coupling”
- Tactical meaning: More severe impact than individual parameters suggest
Isolated event detection:
- Solar flare + quiet geomagnetic: DF adjusted for D-region only impact
- Visual indicator: Event type shows “D-Layer Absorption”
- Tactical meaning: Higher bands affected, lower bands normal
Trend Analysis
Rate of change matters as much as current value:
- DF rising rapidly: More concerning than high but stable DF
- DF declining steadily: Opportunity developing even if currently high
- DF oscillating: Unstable conditions, monitor closely
Check the trend arrows on SolarCdx.com’s display – they tell you where conditions are heading.
What We Don’t Tell You: Protecting Competitive Advantage
The Disturbance Factor represents years of research and thousands of hours of correlation analysis. While we explain how to use it, we don’t reveal:
- Exact weighting algorithms
- Proprietary correlation multipliers
- Machine learning optimization methods
- Historical validation techniques
Why: Your tactical advantage depends on having superior intelligence that competitors can’t easily replicate. The DF gives you that advantage.
Getting Started: Your First Week with DF Intelligence
Day 1-2: Basic Observation
- Check DF before every operating session
- Compare DF predictions to actual band conditions
- Note correlation between DF and your signal reports
Day 3-4: Event Recognition
- Identify different event types (HSS, CME, Quiet)
- Observe how each affects your station differently
- Start timing band changes with DF trends
Day 5-7: Tactical Integration
- Plan operating sessions around DF predictions
- Use band recommendations for frequency selection
- Anticipate condition changes before they happen
The Bottom Line: Intelligence vs. Information
Traditional space weather sites give you information. “K-index is 4.” “Solar flux is 150.” So what?
SolarCdx.com’s Disturbance Factor gives you intelligence. “DF=23.7 indicates moderate disturbance from HSS event, recovery expected in 4 hours, 20m usable with caution, 15m degraded.”
That’s the difference between data and tactical advantage.
Master the Disturbance Factor and master tactical propagation intelligence. Your next QSO success depends on understanding not just what space weather is doing, but what it means for your specific amateur radio operations.
Experience tactical propagation intelligence at SolarCdx.com. Monitor the Disturbance Factor correlation engine, get real-time band recommendations, and transform space weather data into competitive advantage.
73,
W2ADX